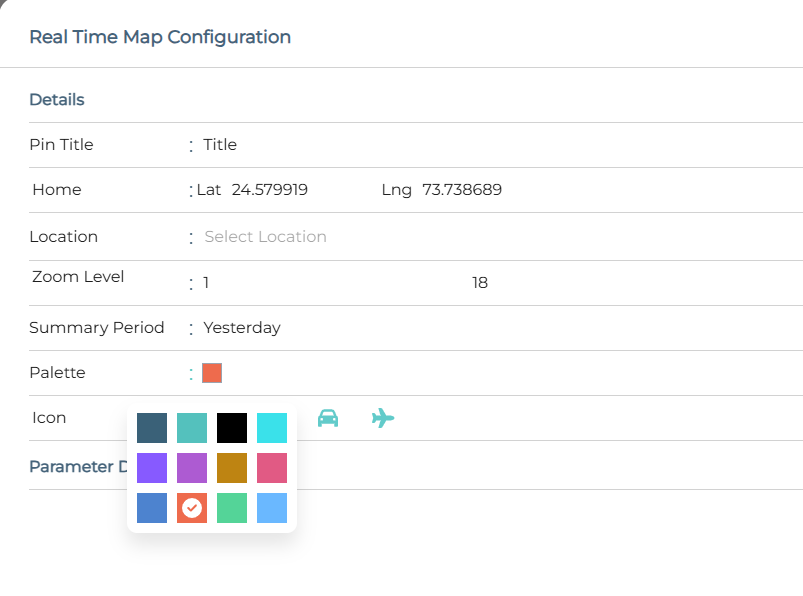
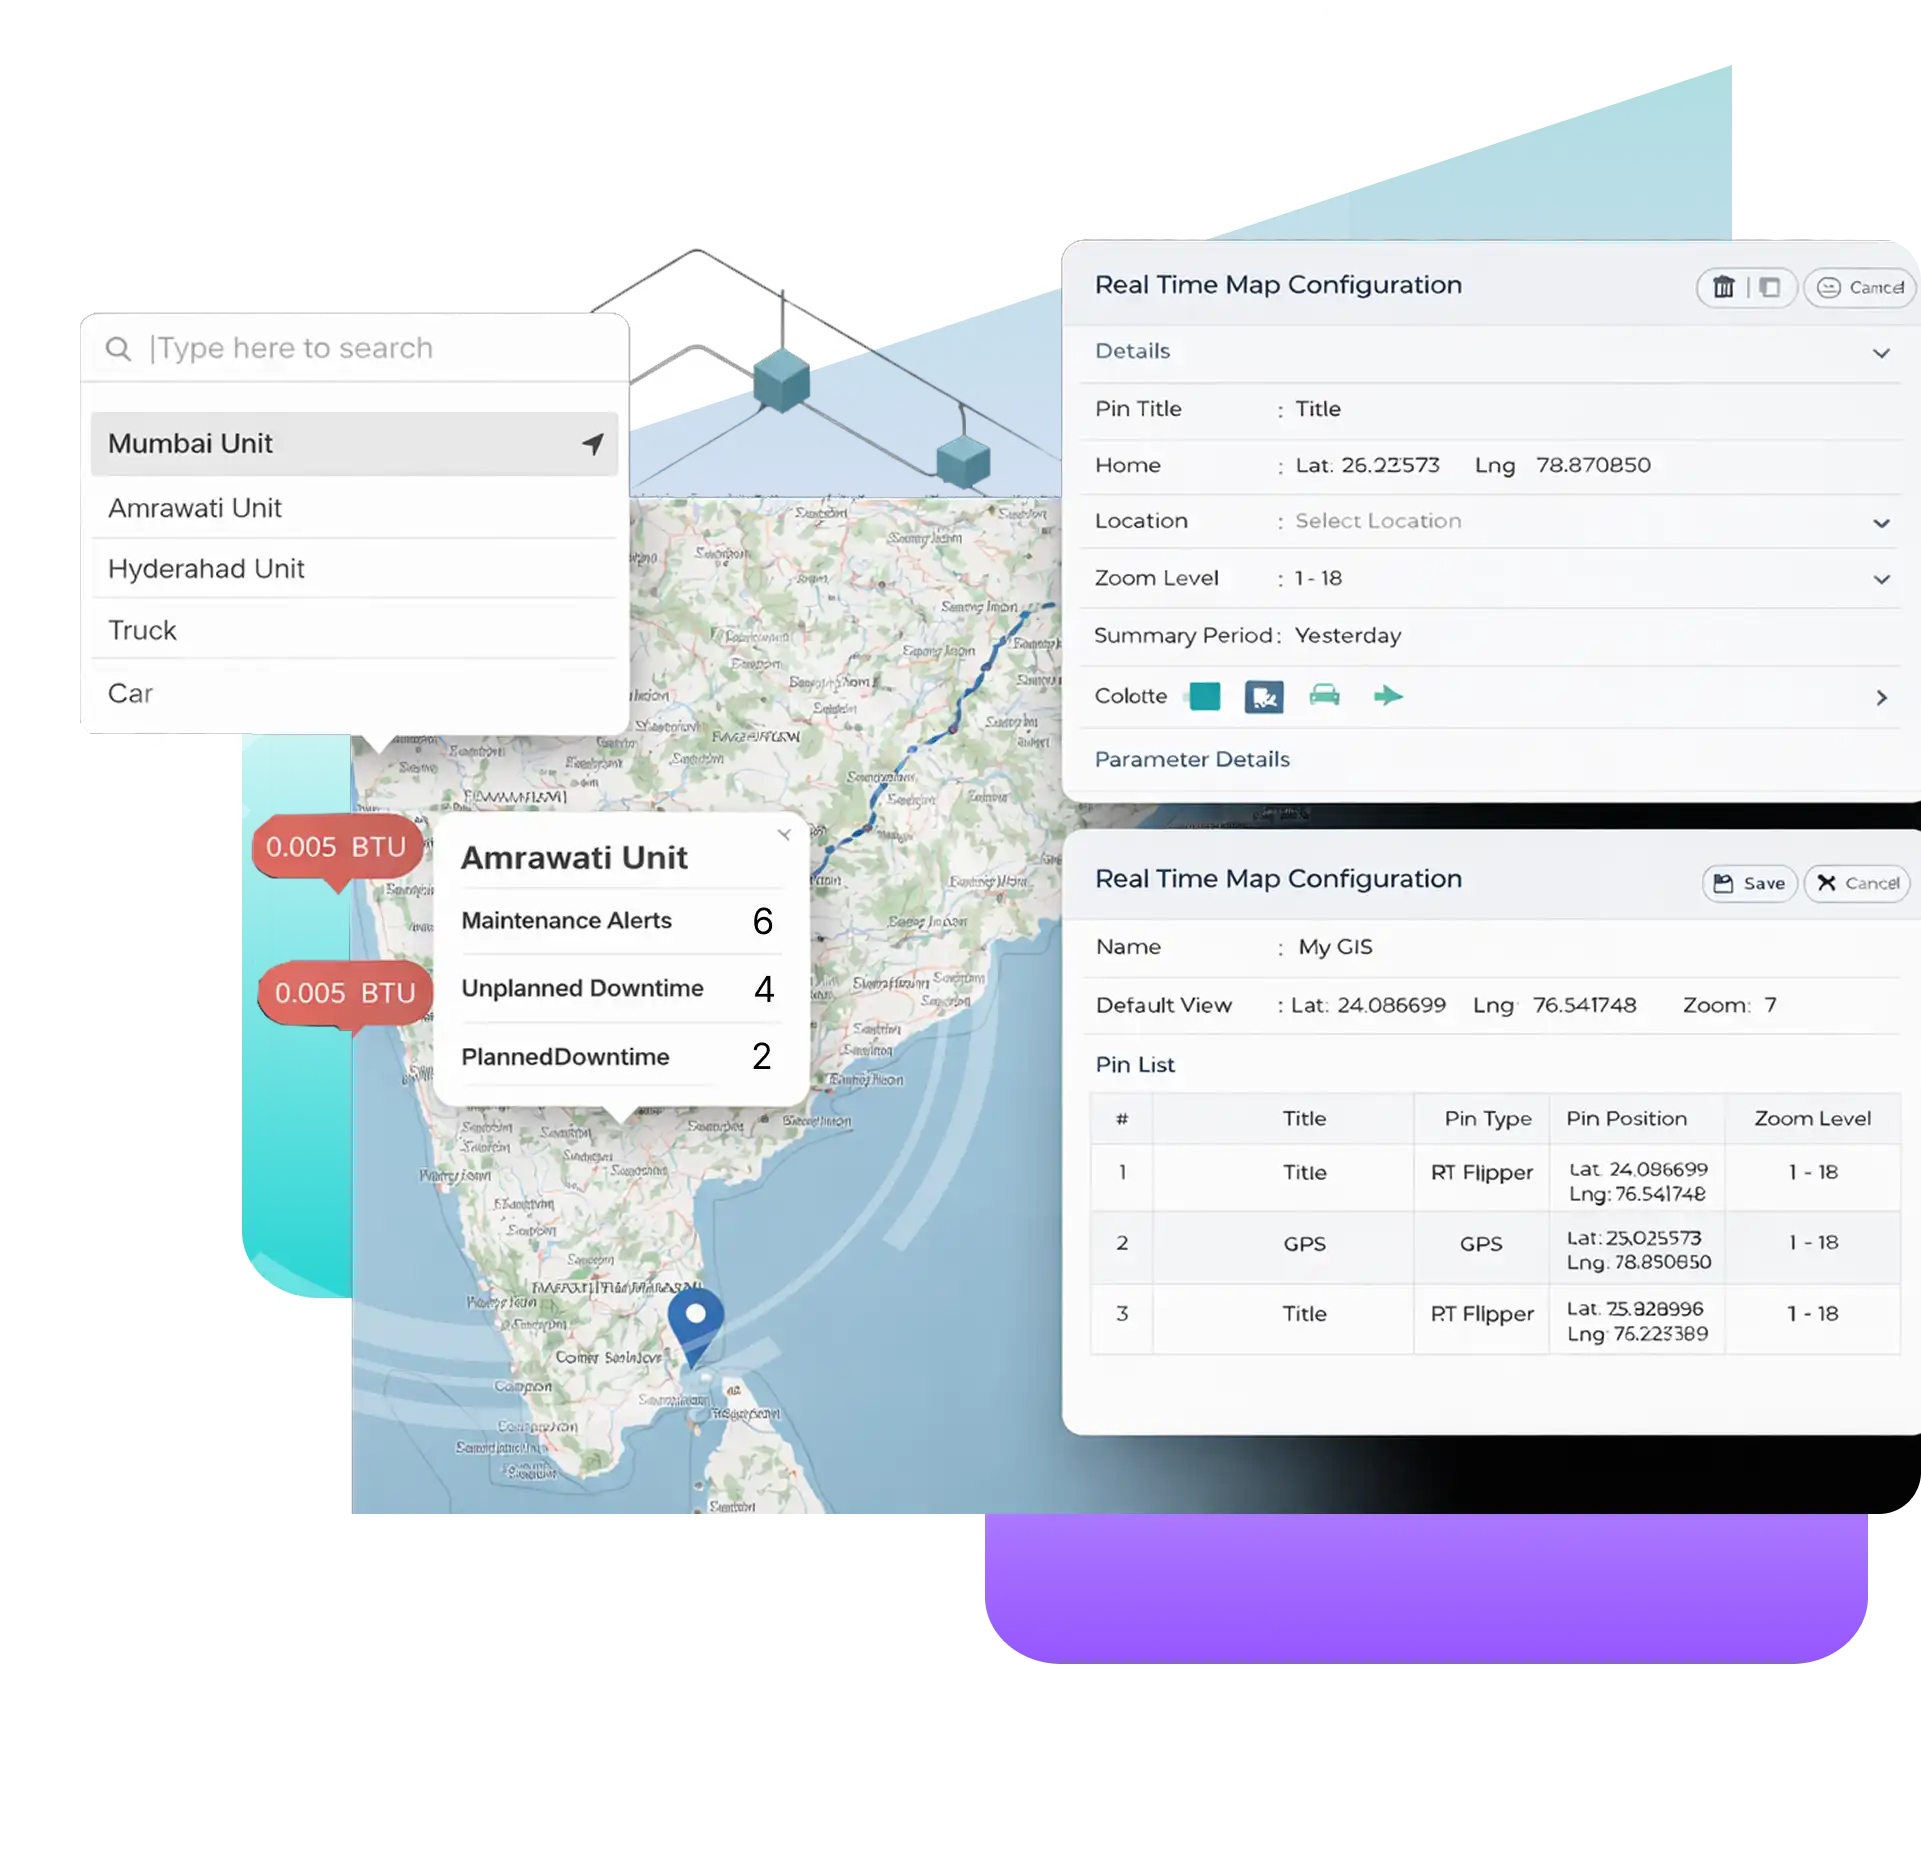
A GIS‑centric asset monitoring product built on the Anexee platform to provide real‑time visibility, alarms, and insights across geographically distributed assets.
Enable
The GIS‑Based Asset Monitoring Solution is built on core Anexee capabilities — not a standalone map tool.
Explore PlatformA robust asset + location model driving data consistency.
Plug & Play connectivity for GPS trackers, PLCs, and IoT sensors.
Integrate location data with ERP and logistical systems.
Automate responses based on geofencing and asset status.
Secure access ensuring users only see assets in their region.
Anexee combines real‑time operational data with geospatial context to deliver powerful GIS‑based monitoring across assets, networks, and distributed sites.
Visualize assets, equipment, and infrastructure directly on interactive GIS maps with real‑time operational status.
Overlay live data, alarms, and KPIs on geographic maps to understand operational conditions by specific location.
Link GIS coordinates and regions to assets in the Unified Namespace for consistent, contextual geographic analysis.
Monitor substations, pipelines, solar parks, and wind farms from a single, integrated enterprise map view.
View alarms on maps to quickly identify affected locations and prioritize response actions based on proximity.
Use multiple GIS layers to visualize assets, regions, and networks independently or as a combined operational view.
Control map visibility and actions using permissions aligned with regional and organizational responsibilities.
Combine GIS views with dashboards to deliver location‑driven insights for both field operations and management.
Scale from a single region to enterprise‑wide deployments with secure, high‑performance geospatial architecture.
When assets are spread across cities, regions, or countries, traditional dashboards fail to provide operational clarity. The GIS‑Based Asset Monitoring Solution brings location context to real‑time asset data.
Lists and spreadsheets can't show you proximity, regional impact, or logistical realities.
See, prioritize, and act faster by visualizing every pump, meter, and machine on an interactive map.
Monitor asset health, status, and performance directly on an interactive GIS map. Each asset is visualized exactly where it operates.
Click on any map pin to see real-time updates from field devices instantly.
Seamlessly zoom from a country-wide view down to a specific site and individual asset.
Detect abnormal conditions and visualize alarms directly on the map. Critical events are highlighted geographically, helping teams prioritize and respond efficiently.
See exactly where a fault has occurred on the map to dispatch the nearest technician.
Pulsing markers and severity-based colors draw attention to critical incidents.
Analyze asset performance and incidents across regions and time. Use analytics to uncover trends, recurring issues, and regional performance differences.
Benchmark performance of assets in different territories.
Visualize asset degradation or improvement over time.
Replay historical movements and alarm states for analysis.
Generate compliance reports based on location and uptime.
Anexee reflects proven practices from industrial projects delivered across manufacturing, utilities, and infrastructure.